
Appearance
Billable Utilisation Report
Track how much of your team's available capacity is being spent on billable work, per team and per user, measured against each person's own target.
Overview
The Billable Utilisation Report is a Standard Report that answers the question every professional services firm asks: of the hours my people actually had available, how many went to billable client work?
It presents the answer at two levels. Each team appears as a row with its aggregated figures, and expanding a team reveals every user in it with their individual numbers. That structure lets you compare teams at a glance and then drill into the individuals driving the team's result.
Targets are not a single firm-wide number. The report reads the annual business hours goal set on each user's profile and uses it to calculate that user's target - and, by aggregation, their team's target. This means a part-time bookkeeper and a full-time senior auditor are each measured against what is realistic for them, rather than against the same blanket percentage.
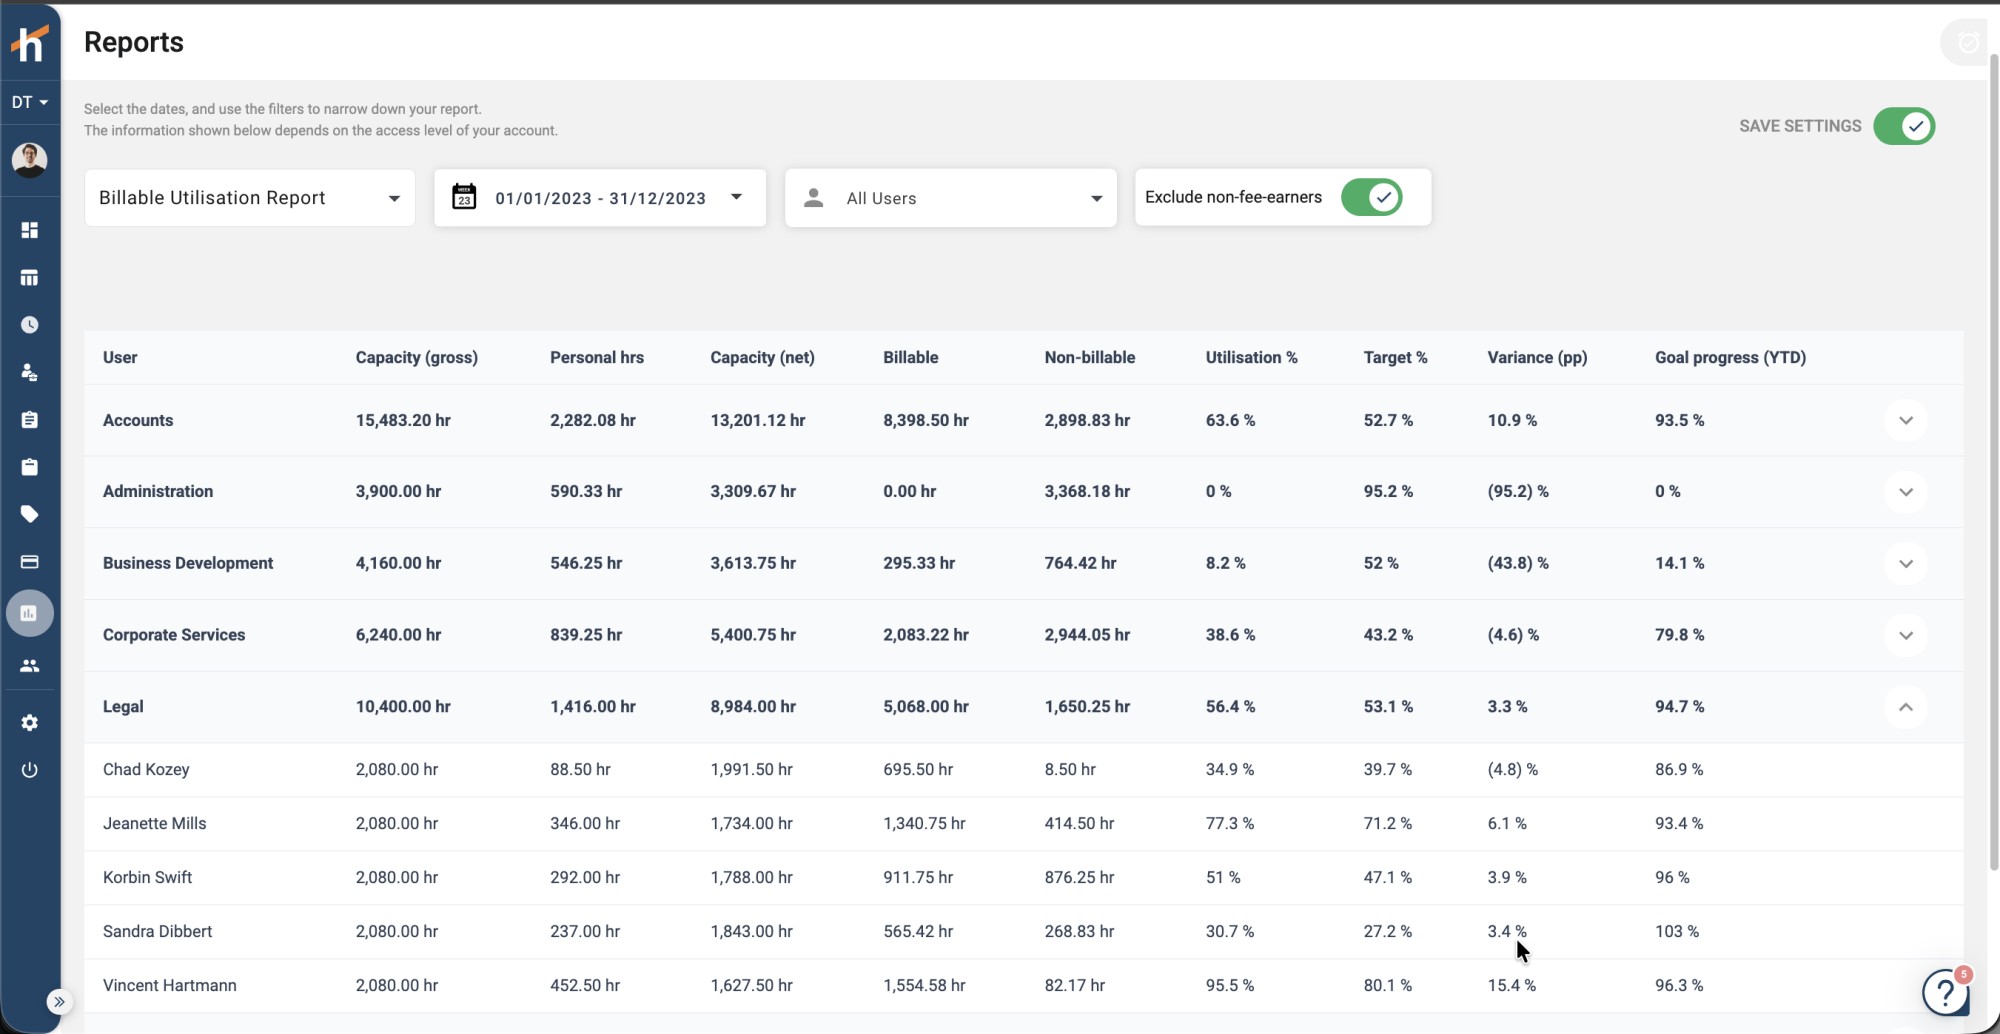
Running the Report
- Navigate to Reports in the left sidebar
- Open the Reports tab
- Select Billable Utilisation Report from the report dropdown
Then set your filters:
- Date Range - the period to measure (for example a full financial year, or a single quarter)
- Users - narrow to specific people, or leave as All Users
- Exclude non-fee-earners - see Excluding Non-Fee-Earners below
Turn on Save Settings if you want your filter selections to persist between sessions.
Understanding the Columns
| Column | What it shows |
|---|---|
| User | The team name on a team row, or the individual's name on an expanded user row |
| Capacity (gross) | Total available hours in the period before any deductions |
| Personal hrs | Personal time recorded in the period - leave, sickness, and other non-working hours |
| Capacity (net) | Capacity actually available for work: Capacity (gross) − Personal hrs |
| Billable | Hours booked to billable business work |
| Non-billable | Hours booked to work that won't be invoiced - internal time and non-billable business hours |
| Utilisation % | Billable ÷ Capacity (net) - the headline figure |
| Target % | The utilisation this person or team is expected to hit, derived from the annual business hours goal on each user's profile |
| Variance (pp) | Utilisation % − Target %, in percentage points. Bracketed values are negative - i.e. below target |
| Goal progress (YTD) | Progress toward the annual business hours goal for the year to date |
Why net capacity matters
Utilisation is measured against net capacity, not gross. Someone who took four weeks of leave isn't penalised for the hours they were never available to work - their denominator shrinks accordingly. This is what makes the percentages comparable across people with very different leave patterns.
Targets and the Annual Business Hours Goal
The report's targets come from the annual business hours goal recorded on each user's profile. That figure represents how many business hours the firm expects that person to deliver in a year, and it drives both the Target % and Goal progress (YTD) columns.
Getting these goals right is what makes the report meaningful:
- A user with no annual business hours goal has no basis for a target, so their target computes as 0% and they drag their team's aggregate down
- Setting realistic, role-appropriate goals means each person is measured against their own expectation rather than a firm-wide average
- Part-time staff should have goals reflecting their contracted hours, not a full-time equivalent
To set or change a goal, edit the user's profile under Team (or Settings → Users) and update the annual business hours goal field.
Excluding Non-Fee-Earners
Not everyone in the firm is expected to bill. Administrators, receptionists, IT staff, and support functions have no billable target, and including them makes team utilisation look artificially poor.
Switch on the Exclude non-fee-earners toggle at the top of the report to drop every user who has no annual business hours goal specified from the figures. Their hours no longer contribute to team aggregates, and they disappear from the user-level breakdown.
The toggle keys off the goal, not a job title
"Non-fee-earner" here means precisely "has no annual business hours goal set" - nothing else. If a genuine fee earner is missing their goal, this toggle will silently exclude them too. If a whole team appears with a 0% target, that's the first thing to check.
Reading the Results
Target %, not Utilisation %, is the benchmark. A 63.6% utilisation against a 52.7% target is a strong result; a 38.6% utilisation against a 43.2% target is a shortfall. The Variance (pp) column does this comparison for you, which is why it's usually the fastest column to scan first.
Expand the outliers. A team sitting well below target rarely means the whole team is underperforming - more often one or two individuals account for most of the gap. Expanding the team row shows immediately whether the shortfall is broad or concentrated.
Check the extremes in both directions. Sustained utilisation far above target is as much a signal as one far below: it can indicate an overloaded individual heading for burnout, or a target that was set too low and needs revisiting.
Reconcile against non-billable time. A low utilisation figure alongside a high non-billable figure tells a different story from a low figure with little time booked at all. The first is a work-mix problem; the second is a time-recording problem.
Common Workflows
Workflow: Quarterly Team Utilisation Review
- Run the report with the quarter as your date range
- Turn on Exclude non-fee-earners
- Scan the Variance (pp) column at team level to see which teams are ahead of or behind target
- Expand any team with a materially negative variance and identify the individuals driving it
- Cross-check those individuals' Non-billable hours to understand where their time actually went
Workflow: Annual Goal Setting
- Run the report for the full year just ended
- Compare each user's actual Utilisation % with their Target %
- Where variance is consistently large in either direction, revisit that person's annual business hours goal for the coming year
- Ensure every fee earner has a goal set, so nobody is silently excluded by the non-fee-earner toggle
Troubleshooting
Problem: A user shows a 0% target
That user has no annual business hours goal on their profile. Either set one, or switch on Exclude non-fee-earners if they genuinely aren't expected to bill.
Problem: Team utilisation looks far too low
Non-fee-earners are probably included in the aggregate. Switch on Exclude non-fee-earners and compare.
Problem: I can't see the report
Standard Reports are permission-controlled and are not visible until they're shared with you or you hold the "View All Standard Reports" permission. See Standard Report Permissions.
Problem: Utilisation doesn't match my own calculation
Check whether you're dividing by gross or net capacity. The report uses net - gross capacity less personal hours.
Related Topics
- Reporting & Analytics - All Standard Reports and how to share them
- Non-Billable Hours - How billable and non-billable business hours are split
- Work in Progress Report - Unbilled work by client
- Teams Management - How users are grouped into the teams this report reports on
Need Help?
For questions about the Billable Utilisation Report, visit our FAQ or contact [email protected].