
Appearance
Tailored Project Statistics
Choose exactly which metrics you see on the Projects summary page and on each project dashboard, and swap statistics on the fly.
🎥 Video Tutorial
A quick demo of pinning your most relevant statistics with Quick Overviews and customising individual dashboards.
Overview
You can now control which statistics appear on your project views instead of being shown a fixed set. There are two places to customise:
- The Projects summary page (the list of all projects).
- Each individual project dashboard.
Custom Summary Views (Quick Overviews)
On the Projects summary page, click the Quick Overviews button to choose the metrics shown on each project card. You can pin up to five data points, and they appear in the order you select them.
Available statistics include (among others):
- Cost, Cost Budget, Period Cost
- Time Budget, Total Time, Billed Time, Non-billable time
- Recoverability and Pro-rated Recoverability
- Amount Invoiced (net and gross), Paid, Unpaid, Unbilled, Written Off, Credits
- Total Charges, Active Jobs, Last Active
- Active Charge-out Rate (when a project's owning team has a specific charge-out rate set)
Click Apply selection to save. Your selection is remembered.
Screens scale automatically
On smaller screens, the number of statistics displayed scales down (for example to four), but your full selection stays saved and reappears when there's room.
Sorting and Exports
- Sorting - every statistic is available for sorting the project list, including ascending and descending order.
- Exports - when you export the project list, all statistics are included in the export, not just the ones you've pinned to the view.
Dashboard Flexibility
On an individual project dashboard you see the default statistics plus an extra one, and you can change them in two ways:
- Swap a statistic on the fly - click any statistic tile to swap it for a different metric.
- Customise the dashboard's set - click the icon next to the dashboard name to choose exactly which statistics show for that specific project. Each dashboard can be customised independently.
Coming soon
This same dashboard flexibility will be rolling out to client profiles in an upcoming release.
The Cost Summary
Statistic tiles tell you what a number is. The Cost Summary tells you what it's made of.
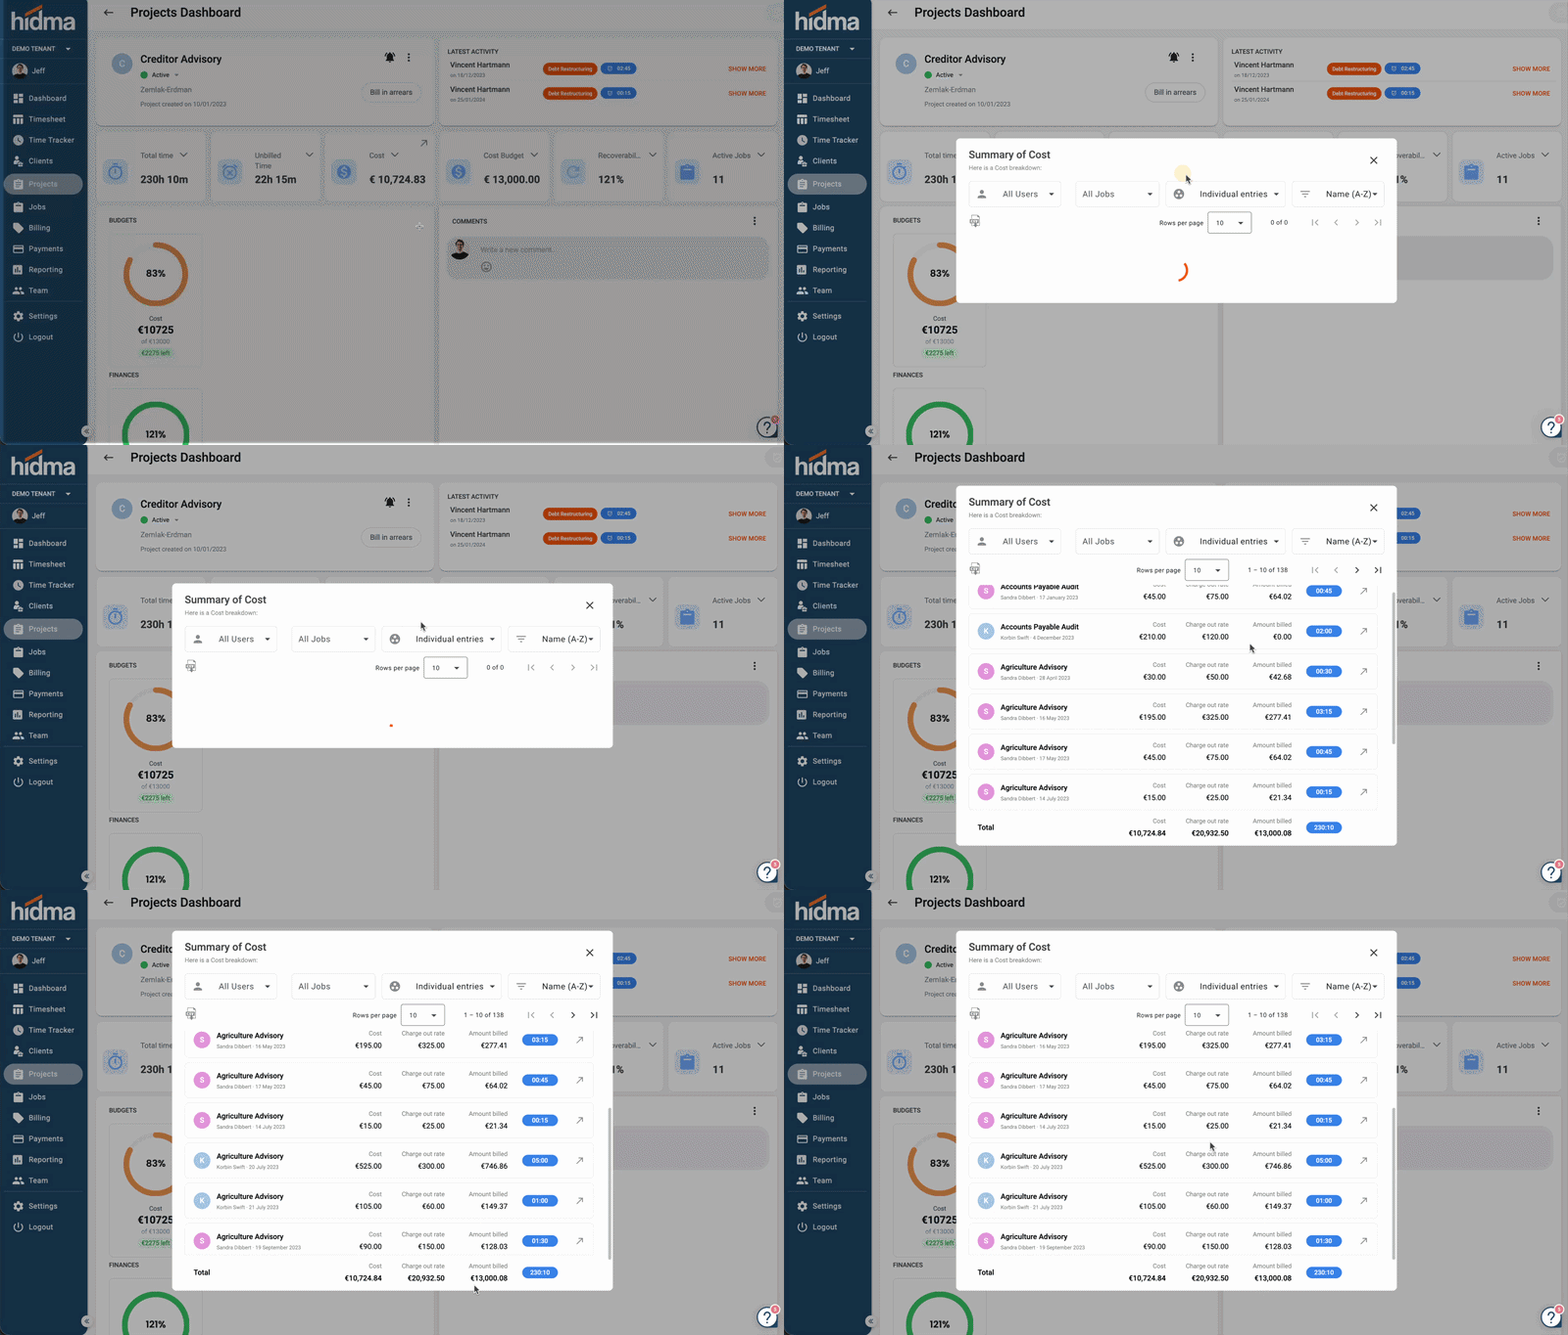
Click the Cost statistic on a project dashboard to open the Summary of Cost dialog - a full breakdown of every entry contributing to the project's cost, alongside what it was charged out at and what has actually been billed.
What the Breakdown Shows
Each line in the summary shows:
- The job the time was booked to
- The user who booked it and the date
- Cost - what the time cost the firm
- Charge out rate - the rate that applied
- Amount billed - what has actually been invoiced for it
- The duration of the entry
- An arrow to jump straight through to the underlying record
A Total row is pinned to the bottom of the dialog, so the running totals for cost, charge-out, and amount billed stay visible however far you scroll.
Cost and charged aren't the same number
Seeing cost, charge-out, and amount billed side by side on the same line is the point of this view. Where the third column falls short of the second, that's unrecovered work - and the summary shows you exactly which entries it came from.
Grouping, Filtering, and Sorting
Controls along the top of the dialog let you reshape the view:
- Users - filter to a specific person, or leave as All Users
- Jobs - filter to a specific job, or leave as All Jobs
- Grouping - switch between Individual entries and grouping the summary by User or by Job. Grouping is the quickest way to answer "who has consumed this budget" or "which workstream is eating the cost"
- Sort - order the results (for example Name (A-Z))
- Rows per page and pagination for projects with a long history
Exporting to CSV
Click the CSV icon in the top-left of the dialog to export the summary as it's currently grouped and filtered. This gives you the underlying detail for reconciliation, client queries, or write-off decisions outside Hidma.
Permissions
The cost summary exposes detailed cost, charge-out, and billed figures, so access to it is controlled separately. Manage who can see these metrics under Settings → Roles & Permissions. Learn about roles and permissions
Related Topics
- Project Budgets - The budget metrics you can pin
- Budget Notifications - Get alerted on budget progress
- Projects Overview
Need Help?
For questions about customising your project views, visit our FAQ or contact [email protected].