
Appearance
Reporting & Analytics
Access your time and billing data through dashboards, exports, Standard Reports, and the Work in Progress report.
Video Tutorial
Learn about Standard Reports and how to use, share, and manage pre-configured reports in hidma.
Overview
Reporting in hidma gives you visibility into your business through multiple lenses - client dashboards, project dashboards, team views, Standard Reports, and raw data exports. hidma provides both flexible access to raw data for custom analysis and pre-configured Standard Reports for common business questions.
Every hour tracked, every invoice sent, every payment received creates data you can access and analyze. Whether you're reviewing a specific client's financial status, monitoring a project's progress, checking team utilization, or exporting data for external analysis, hidma provides the visibility you need to run your business effectively.
Key Reporting Features
📋 Standard Reports
Standard Reports are pre-configured reports that provide quick answers to common business questions. Access them by navigating to the Reports page and selecting the Reports tab (the raw data queries are now under the All Data tab).
Available Standard Reports:
- Work in Progress Report - Company-wide view of all work in progress across your entire hidma tenant
- Revenue by Project - Billing data organised by project and bill date, combining both bill rows and credit note rows. Rows are only counted towards a project's revenue if their charge type has the Affects Project Revenue toggle enabled. (Previously called Bill Rows by Project.) Credit note amounts now report at their correct values and align with the corresponding Xero account codes.
- Aged Debtors - Snapshot of outstanding invoices grouped into aging buckets, so you can see at a glance how much each client owes and how overdue the balance is. Works whether you record payments via the Xero integration or directly in hidma.
- Detailed Aged Debtors - The same aging view drilled down to the individual bill level. Use it when you need to see which invoices are sitting in each bucket, not just the totals.
- Billable Utilisation Report - Billable utilisation broken down per team and per user, measured against each person's own target. Targets are derived from the annual business hours goal on each user's profile, and an Exclude non-fee-earners toggle drops anyone without a goal from the figures.
- Hours by Team - Total hours worked by each user, pivoted into a column per team.
- Detailed Hours by Team - The Hours by Team pivot broken down by client and project. Opens as one row per user; expand a user to see the clients and projects those hours were booked to, so you get a split by project for every person.
- Realisation Rate - How much of the standard value of your billed time you actually invoiced, by team. Shows recorded, billed and unbilled hours, standard value, amount billed, write-down and realisation %. Expand a team to see each person in it.
- Detailed Realisation (Billing) - The same realisation figures for each person on each project, with extra filters for client type, client and project.
- Additional reports are released with monthly updates
Customisable Aging Buckets
The aging buckets used by both Aged Debtors reports are fully customisable. If the default timeframes don't match how your organisation tracks overdue invoices, contact support@hidma.com and we'll update them for your tenant.
Using Standard Reports:
Each report provides comprehensive filtering options:
- Date Range - Select the time period to analyze
- Users - Filter by specific team members
- Teams - Focus on particular teams
- Client Types - Filter by client classification
- Clients - Select specific clients
- Projects - Narrow down to individual projects
All Standard Reports can be downloaded for offline analysis or external reporting.
Sharing Reports:
Users with the appropriate permissions can share reports with others:
- Open the report you want to share
- Click the Share Report button
- Search for a user or team name
- Choose the permission level:
- View - Can see and run the report
- Edit - Can see, run, and share the report with others
- Click Add to grant access
- Click Done when finished
Shared users receive an email notification and gain immediate access to the report.
Permission Requirements
See Standard Report Permissions below for details on which roles can view, access all, or manage Standard Reports.
💰 Work in Progress (WIP) Report
The WIP report is the primary financial report in hidma, showing time you've worked and approved but haven't yet billed - representing revenue you've earned but not collected. This is critical for cash flow management, since high WIP balances mean money you should be collecting is sitting unbilled.
The report breaks down unbilled work by client, showing who has the largest balances. You can drill into specific projects to see which engagements have pending work, view which team members have unbilled time, and see how long work has been sitting unbilled (aging analysis). Regular WIP review - ideally weekly - ensures you bill promptly and don't let significant work accumulate unbilled due to simple oversight. View WIP Report Guide
📊 Client Dashboards
Each client has a dedicated dashboard showing their complete engagement with your firm. Client dashboards display current work in progress amounts, outstanding bills and payment status, recent activity and time logged, all projects associated with the client, complete billing history, and financial summaries showing total billed and paid amounts.
Navigate to any client and their dashboard provides immediate visibility into the relationship's financial health, what work is currently in progress, what's been billed, and what's been collected. This consolidated view helps you understand each client relationship at a glance.
📁 Project Dashboards
Project dashboards show detailed information about individual engagements. For any project, you can see total hours logged broken down by team member, budget consumption showing actual versus estimated hours, billing status including invoiced and unbilled amounts, team assignments showing who's working on the project, and project timeline with creation and status dates.
These dashboards help project managers monitor progress, understand resource allocation, track budget consumption, and identify when projects need attention before problems escalate.
👥 Team Views
The team view provides managers with oversight across their entire team. See hours logged by each team member for any time period, breakdown of billable versus non-billable time, which projects team members are working on, and overall team productivity metrics.
Team views help managers balance workloads, identify team members with capacity for additional work, spot potential burnout from overallocation, and understand team utilization patterns over time.
📈 Personal Dashboard
Every user has a personal dashboard showing their own performance metrics. See your hours tracked for the current period, split between billable and non-billable work, projects you're currently working on, your recent time entries, and your productivity trends over time.
Personal dashboards help individuals understand their own work patterns, ensure they're tracking time properly, and maintain awareness of their billable utilization.
Missing Rate Indicators
A cost or chargeable figure calculated from a user who has no rate configured is not just incomplete - it is understated, and it looks exactly like a real number. To stop unassigned rates quietly skewing your reporting, every report that shows a cost or chargeable amount now flags the affected figures.
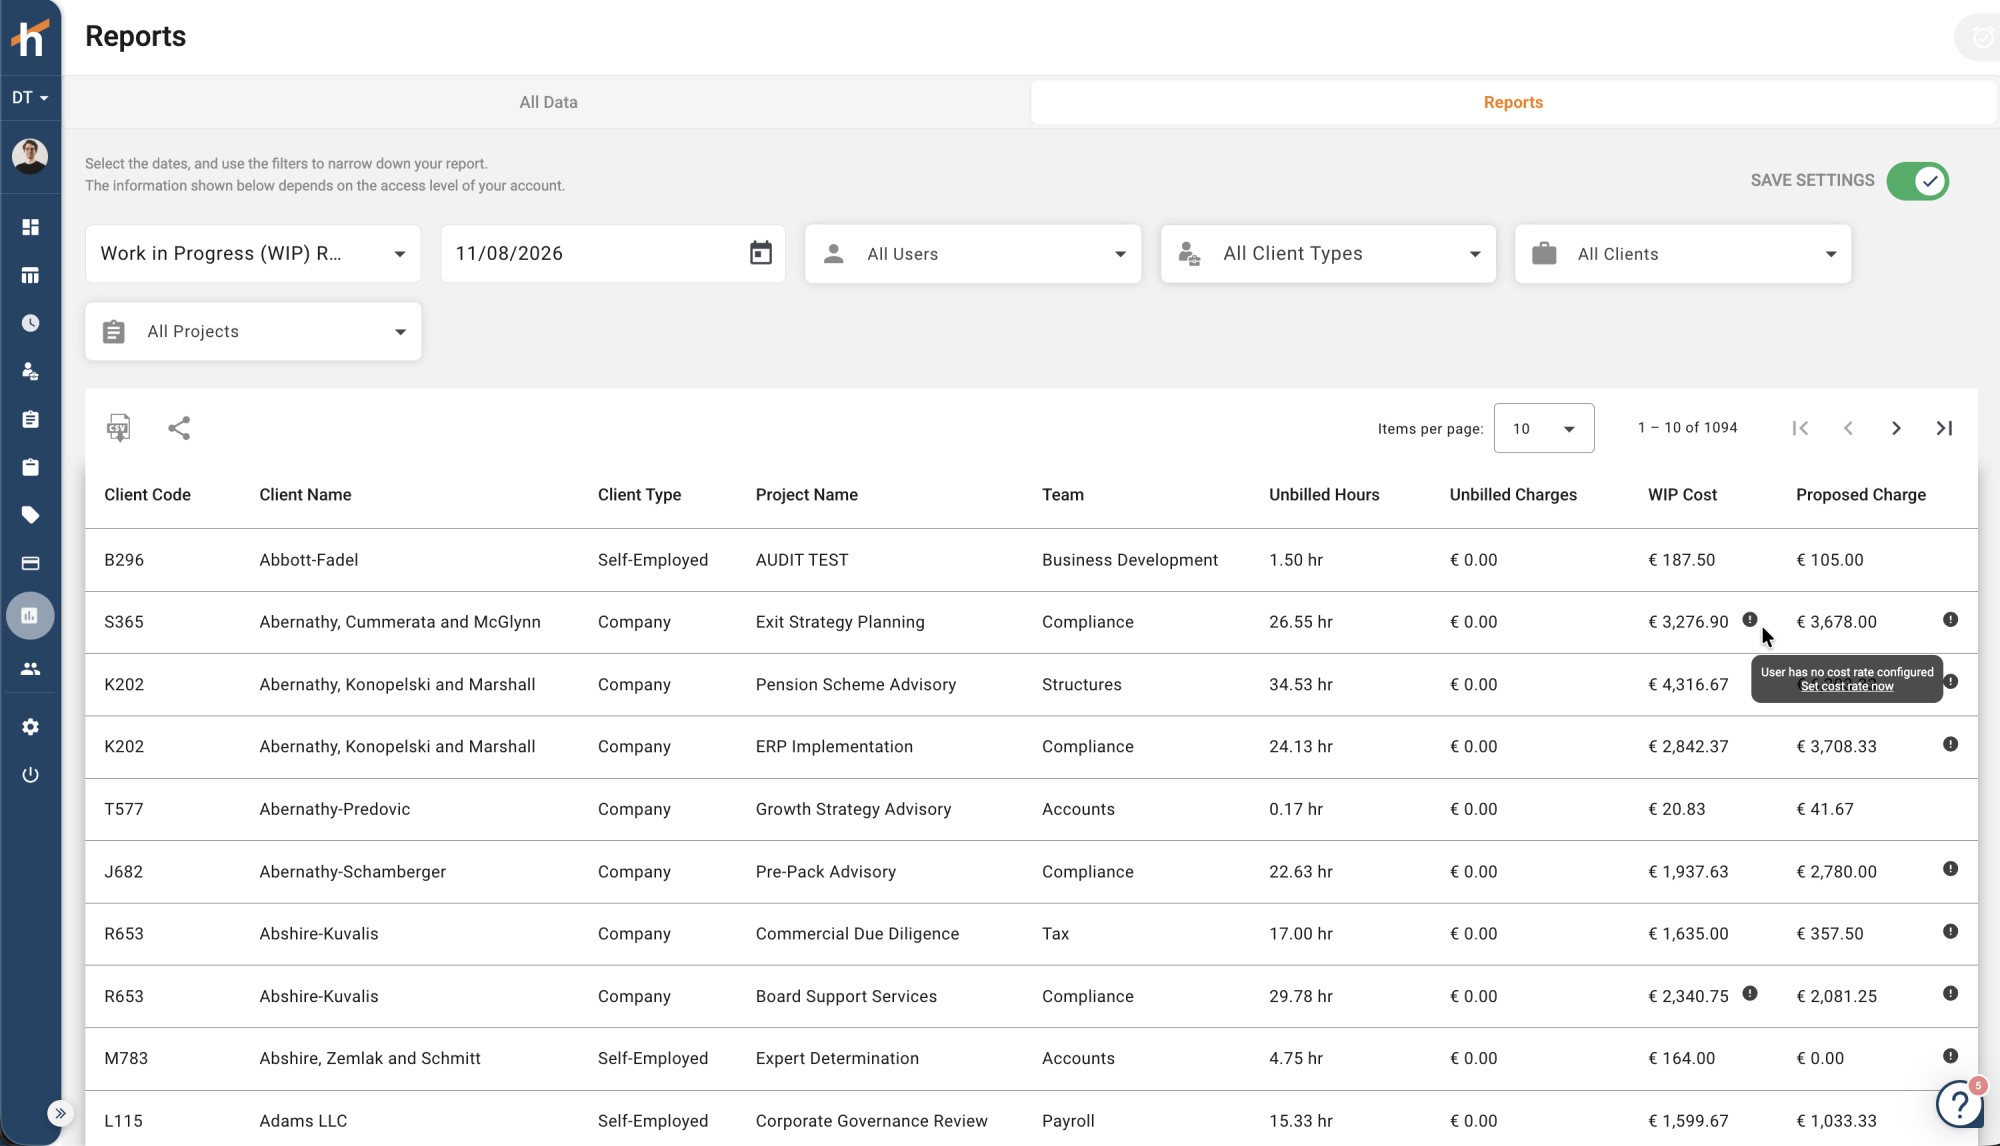
On screen: a warning icon appears next to any value that was computed with a missing rate. Hovering it explains exactly what's absent and offers a way to fix it there and then - for example "User has no cost rate configured" with a Set cost rate now link. Icons appear on both the individual cell and, where relevant, at row level.
In CSV exports: the flags carry over as dedicated warning columns, so a figure that was flagged on screen is still identifiable once the data is in Excel. An export that looks clean genuinely is clean.
Treat a flag as a data issue, not a display issue
The reported number isn't wrong arithmetic - it's arithmetic performed over an incomplete rate table. Fix the underlying rate rather than working around the figure, and every report using it corrects at once. See Charge-Out Rates for how rates resolve.
Data Access and Export
Raw Data Reporting
hidma's reporting section provides access to raw transaction data with extensive filtering capabilities. You can filter by date ranges, clients, projects, team members, job types, billable status, and many other dimensions. This filtered data view shows the actual entries in your system - time logged, bills created, payments received - with all their detailed attributes.
The raw data approach gives you complete flexibility to analyze information however you need. Sort by any column, filter by multiple criteria simultaneously, and drill down to individual transaction details. Save your filter settings so they persist between sessions, letting you quickly access the same view repeatedly.
Export Options
CSV Export Export filtered data to CSV format for analysis in Excel or other spreadsheet tools. CSV exports give you raw data you can manipulate however needed - create pivot tables, build custom charts, integrate with financial systems, or perform calculations not available in hidma.
The export includes all visible columns and respects your current filters, so you get exactly the data you've filtered for in a format you can work with externally.
Export parameters at the top of every file Every CSV and Excel export lists the parameters used to create it at the top of the file, such as the date range, the teams or users selected, and any other filters applied. Anyone opening the file, whether a colleague you share it with or you months later, can see at a glance what it contains.
PDF Export Generate formatted PDF documents suitable for printing, emailing, or archiving. PDF exports maintain professional formatting and are ideal when you need to share information in a fixed format that recipients can't modify.
Filtering and Customization
Most views in hidma offer extensive filtering to focus on exactly what you need:
Date Range Filtering - Select specific periods (last week, last month, last quarter, custom ranges) to analyze particular timeframes.
Client/Project Filtering - Focus on specific clients or projects to isolate their activity from everything else in the system.
Team Member Filtering - View activity for specific individuals or teams to understand personal or group productivity.
Status Filtering - Filter by approval status, billable status, payment status, or other state indicators to find entries meeting specific criteria.
Save Filter Settings - Your filter selections can persist between sessions, letting you return to the same view repeatedly without reconfiguring filters each time.
Standard Report Permissions
Access to Standard Reports is controlled by three specific permissions:
| Permission | What It Allows |
|---|---|
| View Standard Reports | Can see and run Standard Reports, but only when reports are shared with them. By default, no reports are visible until someone shares a report with you. |
| View All Standard Reports | Can see and run all Standard Reports automatically, including new reports as they're released with monthly updates. No sharing required. |
| Manage All Standard Reports | All of the above, plus the ability to share reports with other users or teams. |
Permission Hierarchy:
- Users with only View Standard Reports must wait for reports to be shared with them
- Users with View All Standard Reports automatically see all available reports
- Users with Manage All Standard Reports can control who else has access
Tip
If you need access to a report you can't see, ask someone with "Manage All Standard Reports" permission to share it with you, or request the "View All Standard Reports" permission from your administrator.
Best Practices
Reporting Best Practices
Review WIP Weekly Establish a weekly routine for reviewing the Work in Progress report to identify billing opportunities. Check WIP every Monday morning or Friday afternoon to see what work has been completed but not yet invoiced. This regular discipline prevents revenue from accumulating unbilled and improves cash flow by ensuring prompt invoicing.
Use Dashboards for Daily Oversight Client and project dashboards provide at-a-glance visibility into relationship and engagement health. Make checking relevant dashboards part of your daily routine - look at active client dashboards to spot issues, review project dashboards to monitor budget consumption, and use your personal dashboard to track your own productivity.
Export for Deep Analysis While dashboards provide quick visibility, export data to CSV when you need deeper analysis. Build custom pivot tables to understand patterns, create charts visualizing trends over time, or combine hidma data with information from other systems for comprehensive analysis. Raw data export gives you unlimited analytical flexibility.
Filter Strategically Rather than looking at all data all the time, use filters to focus on what matters for your current question. Analyzing a specific client? Filter to just that client. Reviewing team performance? Filter to your team members. Looking at last quarter's activity? Filter to that date range. Focused filtering makes large datasets manageable and highlights relevant patterns.
Save Common Filter Combinations If you frequently return to the same filtered view - perhaps WIP for top ten clients, or your team's billable hours this month - save those filter settings so they persist. This eliminates the need to reconfigure filters repeatedly and makes accessing your common views much faster.
Act on What You See Dashboards and reports only create value when insights drive action. If a client dashboard shows large outstanding balances, follow up on payment. If WIP reports show old unbilled work, create invoices. If a project dashboard shows budget overruns, have conversations with the client. Use visibility to inform decisions and actions, not just passive observation.
Related Topics
Key Reports and Dashboards
- Work in Progress Report - Monitor unbilled work
- Billable Utilisation Report - Billable capacity per team and per user
- Realisation Reports - How much of the standard value of billed time was invoiced
- Client Management - Client dashboards
- Project Management - Project dashboards
Financial Operations
- Creating Bills - Convert WIP to revenue
- Recording Payments - Track collections
- Bank Accounts - Financial tracking
What's Next?
Ready to use hidma's reporting capabilities effectively?
For new users:
- Review your personal dashboard to understand your tracked time
- Explore client dashboards to see relationship status
- Run a WIP report to see unbilled work
For managers:
- Set up weekly WIP report review routine
- Check team views to monitor team productivity
- Use project dashboards to track engagement progress
Need Help?
Browse specific reporting topics using the sidebar, or search for what you need in the search bar above.